Chapter Four -- Findings
4.0 Introduction
In a pragmatic approach a combination of data collection and analysis methods must be grasped upon in order to facilitate an effective understanding of such issues (Ary et al, 2009; Saunders et al, 2009). Thus, a mixed method approach is used in this study from collecting and analysing quantitative and qualitative data in line with the pragmatic approach. Quantitative data is obtained through distributing questionnaires to the selected sample, subsequently; the information and key themes is then directed to guide the design of a focus group.This chapter addresses the quantitative and qualitative data collection and analysis along with reviewing the sample characteristic for the benefit of the reader, before presenting a breakdown of the results.
4.1 Quantitative Data Collection and Analysis
The preceding chapter addressed quantitative data was obtained by means of questionnaires. The aim of quantitative data collection was to gather information by capturing key themes in order to understand employee attitudes and perceptions of organisational change.
Data Collection Instrument
Twenty questions were presented on the questionnaire, separating the questionnaire into two main sections. The first section consisted of the respondents’ information, this section aimed to assess the respondent’s demographic information, such as age, gender, ethnicity, job position, and the respondent’s length of service. It is an essential component to test the demographic sample as it can be useful to understand if the sample is biased and whether the sample can be measured to represent the population (Bradburn, Sudman & Wansink, 2004). Subsequently, eight questions based on change invited respondents to indicate whether they “strongly agree, agree, unsure, disagree or strongly disagree” with a statement (Likert scales). Additionally, five questions on change invited responses on a closed format structure (i.e. multiple choice questions). Overall, a number of questions were knowingly reversed in order to reduce bias.
Sample Characteristic
The final questionnaire sample consisted of 31 employees by means of voluntary and anonymous participation, out of a potential 36 employees; an overall response rate of 86.1%. Several questionnaires were completed individually during a visit to the company, and the others were later collected. The findings suggested that there were considerably more females (74.2%) than male employees (25.8%) (See Table 1).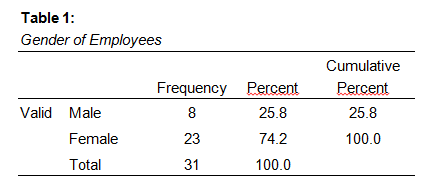 |
| Gender of Employees |
4.1.1 Main Findings
The analysis of the data was obtained by using inferential and descriptive statistics. The names of the measures were given by measuring employee experiences and expectations with organisational change, as well as considering the managers role. Thus, analysing the differences between the measures and association appeared to be the most appropriate way, demonstrating correlation analysis of the measures. Primarily, the most significant correlations were found necessary to be reported.
 |
| Descriptive Statistics for all Employees |
 |
| Variable of all Employees: Participation |
 |
| Variable of all Employees: Confidence |
 |
| Correlations of Variables of all Employees |
 |
| (2) Correlations of Variables of all Employees |
Differences based on gender
The correlations of the sample between male and female employees are presented below to evaluate the differences and coefficients between the variables.
 |
| Correlations of Variables of all Males |
 |
| (2) Correlations of Variables of all Male |
 |
| (1) Correlations of Variables of all Females |
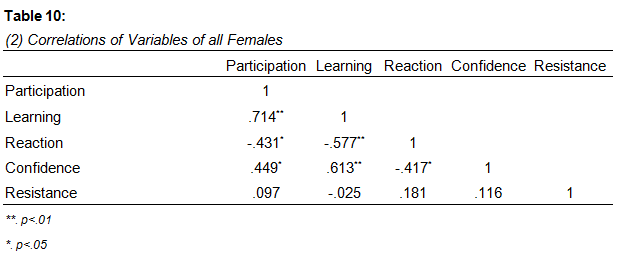 |
| (2) Correlations of Variables of all Females |
Table 10 suggests that the coefficient for the selected variables of all females is considerably high, as well as following the same pattern as for the whole data set. There is a strong link between LEARNING and PARTICIPATION, as well as LEARNING and CONFIDENCE. Additionally, there is a much stronger correlation (negative) between LEARNING and REACTION as compared to the whole data set.
Differences based on length of service
The employees’ length of service analysis was conducted by dividing results into 0-3 years and 3-5+ years categories. Correlation analyses for each data set were performed after analysing the variables REACTION and RESISTANCE using a frequency table to determine employees’ attitude and perception in conjunction with their length of service.

 |
| Employees Who Have Been Working at New Look for 0 to 3 years |
Table 11 highlights the variable (REACTION) on how employees would react to sudden change in an organisation (employees working 0-3 years). The frequent choice that employees made was “Go with the flow” with a percentage of 42.1%, and 26.3% of employees selected “Acceptance”, as well as the 21.1% that selected “Force yourself to deal with it”. Conversely, Table 12 highlights the choice given to the reason why employees are resistant to change (RESISTANCE). The most frequent choice was “Fear of unknown” (47.4%) and “Fear of personal impact” (21.1%).
 |
| Correlations of Variables for Employees Who Have Been Working at New Look for 0 to 3 Years |
Table 13 highlights the correlations between the selected variables for employees that have worked with the company for 0 to 3 years. There is a strong positive relationship between CO-EFFORTS and POSITION, suggesting that employees that have been working less than 3 years determine their position by company efforts, as well as the readiness to participate (PARTICIPATION). However, there was no significant relationship between TIME and PARTICIPATION as compared to the whole data set.
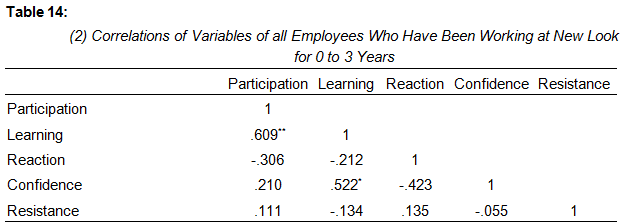 | ||
(2) Correlations of Variables of all Employees Who Have Been Working at New Look
|
Furthermore, employees that have been working between 0 to 3 years at New Look showed higher correlation coefficients for the selected variables, specifically between LEARNING and PARTICIPATION, and LEARNING and CONFIDENCE. Conversely, there appears to be a fairly weak link between REACTION and CONFIDENCE as compared to the whole data set.
 |
| Employees Who Have Been Working at New Look for 3 to 5 years plus |
 | ||
| Employees Who Have Been Working at New Look for 3 to 5 years plus |
 |
| New Look for 3 to 5 years plus |
 | ||
| (2) Correlations of Variables of all Employees Who Have Been Working at New Look |
Table 18 suggests a low coefficient between the selected variables for employees working over 3 years with the company as compared to the whole data set. CONFIDENCE and LEARNING are the only variables that are significantly correlated, suggesting that organisational support is required for encouragement and confidence. Conversely, there is a weak relationship between LEARNING and PARTICIPATION when compared overall, this suggests that employees that have been with the company for over 3 years perceive organisational learning and participation as considerably low during the change process.
Testing Hypotheses
Chapter 2 proposed five hypotheses; subsequently, correlation analyses were conducted based on these hypotheses tested against the variables.
 |
| Correlations of Variables of all Employees- Testing Hypothesis 1 |
 |
| Correlations of Variables of all Employees- Testing Hypothesis 2 |
 |
| Correlation of Variables of all Employees- Testing Hypothesis 3 |
 |
| Correlations of Variables of all Employees- Testing Hypothesis 4 |
 |
| Correlations of Variables of all Employees- Testing Hypothesis 5 |
4.2 Qualitative Data Collection and Analysis
The aim of the qualitative data collection was to obtain a depth of information to explore the role of the manager in organisational change along with investigating their perceptions and attitudes during the change process. The discussion was based on the recent change processes at New Look, these are: organisational policy changes (i.e. contractual changes), and technological changes. Primarily, the data was collected to support the findings of quantitative data.
The most appropriate technique for this section of the study is recognised as the content analysis, where the main themes are distilled from the focus group (see Appendix 8), also known as the “scissor and sort”, a technique used to analyse the findings (Stewart et al, 2007).
- Data Collection Instrument
Information was obtained by means of a focus group following a guide of eight core questions, which were put across the group, as well as demographic questions. Questions were intentionally descriptive following key words such as “what” and “how” to obtain sufficient feedback.
- Sample Characteristic
A total of six members of the management team volunteered to participate in the focus group discussion from the selected store. The discussion proceeded for approximately 45 minutes in which it was audio tape recorded.
4.2.1 Main Findings
Subsequent to following a guide of eight core questions, four main categories were recognised:
1) management responsibilities
2) organisational measures
3) resistance
4) communication and procedures to combat challenges.
- Management Responsibilities
Questions around management responsibilities provided responses on the management teams perceptions around organisational change, these included responses such as “stress; dealing with organisational change”. Conversely, the store manager provided solid information on the management actions, these included responses such as, “plan and prepare prior to change”. Responses such as “fight to address the essential information” were provided by the store manager, as well as management responsibilities of providing employees with the advantages of organisational change, and why the change is taking place.
- Organisational measures and communication
In obtaining managers perceptions on the Human Resources measures and communication to the store, it appears that the organisation conducts solid measures; which includes “planning and preparation through management training”, as well as HR updates, confidential meetings with regional store managers, and distributing posters. However, the store manager felt strongly about insufficient information provided to the management team before change implementation, in which the management team agreed upon. The store manager suggested that the organisation should attain input from store managers before implementing change, and further argued that “managers are the last to know about change”, which the deputy manager agreed and stated “managers should be informed first about change, as they are running the store and should be aware of such changes taking place before hand”. The store manager and the deputy manager argued that “HR has a lack of knowledge in the way the store is run”.
Additionally, organisational measures also included conference calls, which the manager and supervisors stated that it is “a waste of time”, as there information can be communicated through other sources such as instant messages and emails.
- Resistance
The questions around resistance during organisational change proved there is considerably increasing employee resistance towards changes taking place at New Look. The store manager affirmed that there is growing resentment towards changes taking place at New Look, specifically from employees that have been working with the company for a long time, suggesting that employees may fear their job role and “new ways of doing things”. Supervisor A and B further added that “employees clearly do not perceive the change to be the overall organisations decision, but however a managers decision”.
When the group were asked the consequence of resistance among employees, the responses received were a) an effect on organisations productivity, b) a result of absenteeism, c) unmotivated individuals, d) unhappy staff, and e) low performance -“not attaining 100% from staff”. Furthermore, employees’ resistance to change provoked informal communication, such as rumours. The deputy manager added that there were increasing complaints from staff that have been working with the company for a long time, and fewer complaints from new staff.
- Managers communication to employees and procedures to combat challenges
The final questions required responses from the management team to draw attention to their role when dealing with resistance to change. The store manager highlighted “a procedure of consultancy with individual staff” in order to combat negativity from employees, as well as undertaking measures such as training and one-to-one meetings. Subsequently, a discussion emerged on the recent policy change (i.e. contractual changes) in which the store manager argued her duties of presenting employees with reasonable options and compromising with employees, that is “meeting in the middle with the staff before agreeing upon any decisions”. Further measures that the management team clarified were observations on employees in order to recognise resistance to change.
- Observation
Upon observation in the focus group discussion, it appears that the store supervisors had little knowledge about the internal organisation factors; there was limited input from all supervisors and mostly dominated by the store manager. In this way, it can be argued that there is a lack of communication between the store manager and supervisors.
4.3 Conclusion
This chapter has aimed to describe and discuss the results from the quantitative and qualitative stages of the study. The use of a mixed method approach has provided a triangulation of the data, thus improving the validity of the study.
The findings of the study suggest that organisational change is over-managed rather than cultural led, that is, placing a less importance on considering the important human dimension when implementing change in organisations, thus a consequence of uncertainty within the organisation. The analysis across the selected demographic groups suggested perceptions and attitudes towards organisational change, as well as analysing descriptive statistics measuring employee perceptions around the change process, and testing the hypotheses.
The overall findings will be discussed further in the following chapter.
No comments:
Post a Comment